
Export Growth
December 8, 2025
IAI primary production ticked up in October
Written by Greg Wittbecker
The International Aluminum Institute reported global primary production of 6.294 million metric tons for October. When measured on the change in daily outputs over this 31-day cycle, the world gained 0.18% month on month. That may not seem remarkable, but there are some significant differences within the regions that bear discussion.
Here’s a look at the IAI data:
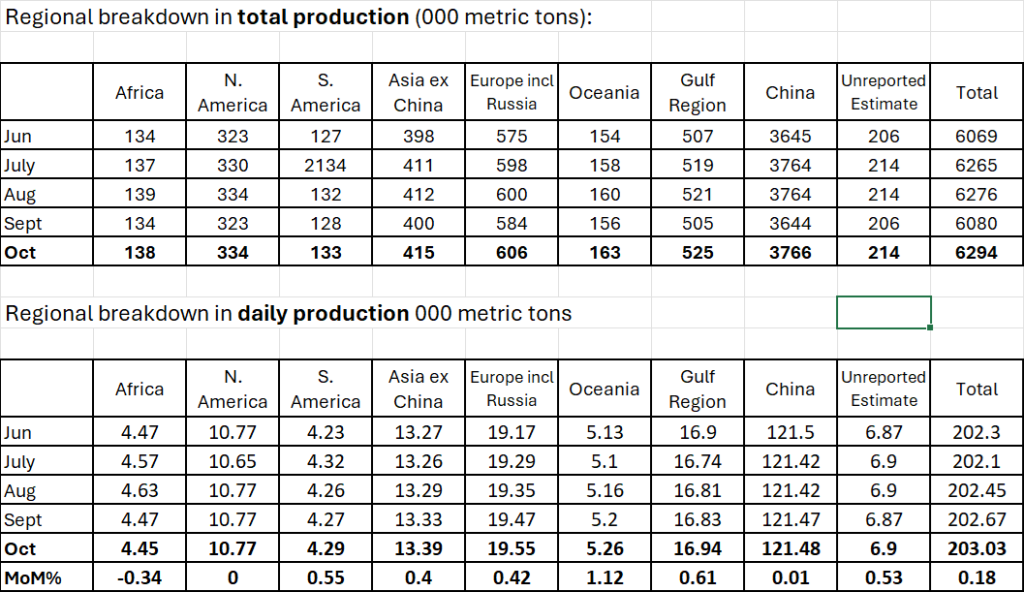
Breakdown by region
Africa is the only region showing decline. Last month, we talked about the impending closure of the Mozal smelter in Mozambique due to not renewing a power contract. Mozal’s owner, South32, is following through on its guidance to the market, which was that pot relining would be halted and there would be an orderly full curtailment by March 31. The drop in October regional production begins to show the effects of these actions. We will see more pronounced month-by-month decreases in the new year as operating pots will start to be taken out of service.
North America showed no change. It’s premature to look for the effects of the Century Aluminum’s Mt. Holly smelter in South Carolina restarting its remaining 50,000 tons/year of capacity. Century said last month it would be June and we should not be looking for any bump in output before April or May.
South America showed an increase from Brazil. Last month, we surmised that Alcoa/South 32 might squeeze some incremental production of their Alumar smelter in Brazil. The numbers suggest the partners have been successful in doing so, with the region up about half of 1% on daily rate.
In Asia ex China, we are starting to see pots being energized at the greenfield projects in Indonesia. There also is some creep coming in India.
Europe including Russia is seeing the restarts we alluded to last month in Germany, Norway and Spain. The combined restarts could contribute 450 tons per day to Europe’s daily rate of output or about 13,950 ton on a 31-day production cycle. Month on month, Europe is up 22,000 tons. We also suspect that is some creep coming output of the Russians.
An electrical excursion at Century’s Grundartangi smelter in Iceland occurred Oct. 24, so the full effect has yet to be reflected in the region’s total output. Based upon company statements on its recent earnings call, this excursion could lower European output on a 31-day cycle by up to 570 metric tons per day or close to 18,000 tons monthly. In the October numbers, we estimate about 4,000 tons was lost.
Oceania production rose 1.12% during October. Alcoa reported in its recent Investor Day presentation that Portland in Australia had only 32,000 tons/year of idle capacity. However, the company has also said it is aiming toward running Portland at 95% of its 358,000 ton/year nameplate capacity. These numbers could be evidence that that objective is being put to the test.
In the Gulf Region, the 0.6% increase may be attributable to faster pot relining and higher metal yields.
China showed no appreciable change in daily outputs and people should not spend a lot of time watching these numbers as the total output approaches the cap. The rotation of Chinese investment into Indonesia is where the output changes are going to come, as Indonesia becomes the proxy for Chinese domestic production.
Why this matters
You might be inclined to question if you need to follow monthly production data. There is a tendency to assume that smelters operate like Swiss watches, always dependable. However, the situation at Century Iceland and South32 Mozambique should serve as a reminder that excursions happen, and our metal supply is vulnerable.
We also must be cognizant of the fact that world ex China production has shifted away from our demand centers of North America, Europe, and North Asia. Today, the leading centers of production (and growth) are the Middle East, Russia, and South Asia.
It is a complex task to drag this metal back to Europe, North America, and North Asia where it is needed. Those supply chains are subject to disruption as we saw during the Suez Canal problem and the current transit issues around the Horn of Africa. We must pay attention to these far-off regions because any change in their production impacts both LME and potentially our local premiums. This is especially important now because Canada enjoys no preference into the US and does not serve as a financial buffer against shocks to seaborne supply.
This supply chain profile is becoming more worrisome now with low stocks. LME stocks are low and 47% of those stocks are Russian which can not be readily consumed. That leaves about 280,000 tons available on the market. That is nothing.
Stocks in general circulation in the physical market are also relatively low. Estimates place non-producer held stocks at 300,000 tons in the US Nothing again. Producers are not coming to the rescue either. Ever since the Global Financial Crisis of 2008, no producer has held excess inventory to support their consumer business. They have transferred responsibility to independent traders. Traders make their money on physical premiums and premium incentives are what triggers stocks to change hands.
It is easy to complain about current Midwest premiums and blame it all on the tariffs. After all, about 70 cents of the current premiums is comprised of tariff costs. However, even stripping that out, you are left with physical premiums around 18 cents per pound. That number still is about three times the long-term historical average. The premium says everything about how our supply has migrated away from North America.
We need to pay close attention to production metrics to gauge whether there are more premium shocks in our future. A smelter going down in India or Africa could trigger the next jolt to our supply.