
Aluminum Scrap Markets

September 5, 2025
PPI and M3 data: Inflation makes aluminum growth disappear
Written by Nicholas Bell
Manufacturers’ Shipments, Inventories, and Orders
The latest Manufacturers’ Shipments, Inventories, and Orders (M3) survey covering July suggests only modest nominal growth in the U.S. metals sector, which vanishes once adjusted for inflation.
In July 2025, shipments of primary metals, which include aluminum alongside other base metals and steel, rose roughly 5.2% in dollar terms year over year, while new orders were up about 4%, according to the Census Bureau data from the M3 survey.
However, producer price indexes (PPI) for comparable goods surged much higher.
The PPI for primary nonferrous metals jumped 38.4% in year-over-year terms. After deflating the primary metal shipments and new orders for price inflation, primary metal shipments actually fell sharply in real terms.
A back-of-the-envelope calculation shows that a 5.2% uptick in value against a 38.4% price increase implies primary metal producers only delivered around 76% of last year’s per-dollar value – or a nearly 25% drop in real output.
The fabricated metal products category, which covers metal components and structural products, tells a similar story.
M3 survey data showed fabricated metal shipments up roughly 3.5% year on year, but a proxy index like the PPI for structural and architectural metal products was about 6.4% higher than the prior-year period.
Again, this suggests a decline in shipment volumes in real terms, albeit not nearly as drastic as the drops in the primary metals category.
Overall, the durable goods data, especially for primary metals and fabricated metal products reveal subdued demand once the strong inflationary boost in proximate pricing is accounted for.
Producers’ books may show higher dollar figures, but it should be remembered that these figures are reported in terms of dollar value and not volume numbers.
Producer price indexes
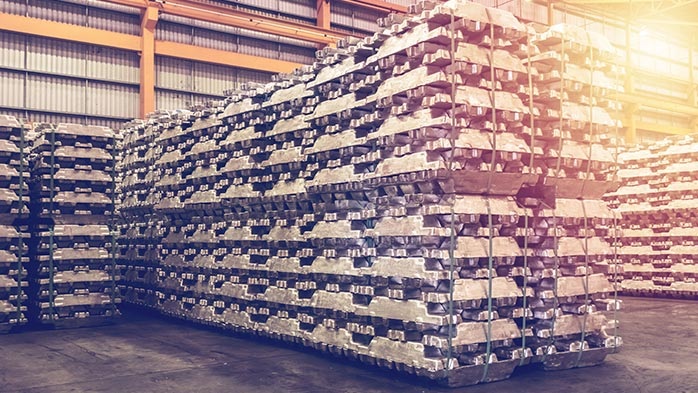
July’s PPI report highlights significant inflation in the aluminum supply chain overall, most pronounced in the near-upstream stages. Prices for raw and semi-finished aluminum materials jumped dramatically.
The PPI for aluminum mill shapes was 13.7% higher on an annual basis and even spiked by 7.4% over the month from June. This surge was likely driven by the corollary surge in cost pressure filtering down from aluminum inputs.
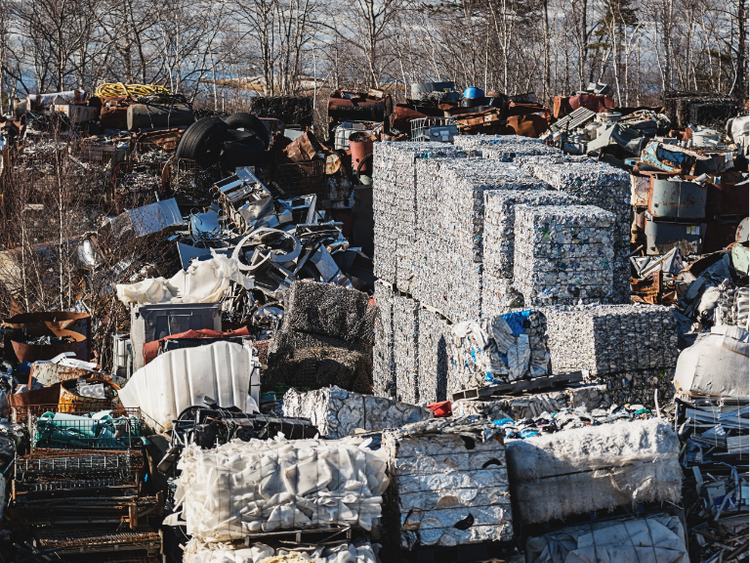
For instance, PPI indications for aluminum base scrap climbed by 12.7% from the prior year’s reading, but even more strikingly, registered a 13.5% month-to-month increase, lifting the index to its highest level ever recorded since tracking began in 1974.
Scrap was notably exempt from the Section 232 tariff hikes that raised duties on primary and semi-fabricated aluminum products to 25% from 10% on March 12, and then again to 50% on June 4.
Even so, scrap became the market’s relief valve, and its price trajectory has been anything but linear. March 2025 posted the highest scrap index since March 2022’s all-time record, but readings fell three consecutive months from April through June.
That pullback set a low base, so when prices rebounded in July, the swing was amplified, vaulting the index to new historic highs.
The whipsaw underscores just how volatile the scrap segment has become, as buyers cycle in and out depending on replacement costs and availability.
Downstream PPI – Secondary aluminum and castings
Downstream in the supply chain, price increases were more muted, suggesting not all costs were passed through directly or were passed through in increments via intermediary stages.
For example, the PPI index for internal combustion engines, which are closely tied to aluminum castings and secondary aluminum alloys, was up only 3.7% year over year in July and just 0.6% month to month on a seasonally adjusted basis.
Aluminum die-castings used in engine covers, brackets, and other smaller components rose just 0.3% year over year and were flat month to month on a non-seasonally adjusted basis. By contrast, aluminum castings excluding die-castings, like permanent mold and sand castings used for larger, more complex parts like engine blocks, pistons, and cylinder housings, jumped 8.9% year over year, though they were flat month to month.
Because heavy castings make up a larger share of an engine’s aluminum weight than die-cast components, the engine index essentially splits the difference between the two casting categories. That positioning reflects at least some pass-through of cost inflation from castings into finished engines, but not enough to offset the sharper increase seen in heavy castings.
In other words, the PPI for internal combustion engines is caught between the relative flatness of die-casting costs and the stronger gains in permanent mold and sand castings, with manufacturers unable to push prices higher in proportion to raw material pressure.
Another layer of margin compression shows up when comparing aluminum mill shapes to their downstream users.
Downstream PPI – Building and construction
As mentioned earlier, the PPI for aluminum mill shapes rose 13.7% year over year on a seasonally adjusted basis.
Before we go any further, just for a frame of reference, the “seasonally adjusted” and “non-seasonally adjusted” distinctions are being made for the purpose of transparency. In some cases, it’s a moot distinction – there was no difference between aluminum mill shapes PPI on a seasonally and non-adjusted basis. In other cases, the difference can represent a 3-4 basis point difference.
That increase in aluminum mill shapes PPI seems to have been split as it moved downstream.
Fabricators in the “aluminum and other sheet metal work” category logged a 7.3% annual rise in the PPI on a non-seasonally adjusted basis, while buyers of “structural, architectural, and pre-engineered metal products” saw a 6.4% increase year-to-year on a seasonally adjusted basis.
Taken together, those increments add up exactly to the original 13.7% jump in mill shapes.
The alignment is undoubtedly coincidental. For instance, “metal doors and frames (except storm)” and “metal windows (except storm sash)” rose 5% and 3.8% year over year on a non-seasonally adjusted basis, respectively, but it underscores the point.
Moreover, it’s worth noting that the “structural, architectural, and pre-engineered” category is not exclusive to aluminum. It is made up of other metals, but the broader category would skew heavily towards steel and aluminum – both of which have been subject to the same Section 232 tariff rate of 50% – meaning the inflationary pressures in that bucket are likely not uniquely aluminum-driven or steel-driven.
Other industrial metals like copper, nickel, etc., play a limited role in these sheet and architectural products, aside from limited ornamental use of brass and bronze, so the trends largely reflect the shared cost dynamics between steel and aluminum rather than a divergence between them.
Since producers and service centers making mill shapes typically sell to upper-midstream manufacturers, who in turn sell to sector-specific downstream suppliers, the PPI alignment exhibits an example of how costs cascade in fragments through the supply chain. It illustrates the broader dynamic that each link absorbs part of the upstream inflation, leaving no segment fully insulated from margin pressure – only varying degrees of exposure.
Raw material prices
One comparison that shows how market prices align with official CRU indexes is aluminum scrap. It also provides a good case study of when seasonally vs. non-seasonally adjusted data is an important distinction.
CRU data showed bare 6063 extrusion scrap rose by 9.3% to $1.40/lb on a midpoint basis in July, closely tracking the 9.2% month-to-month gain in non-seasonally adjusted “aluminum base scrap” PPI from the Census Bureau. Segregated 3003 clips climbed by about 11% in July to $1.45-1.46/lb on a midpoint basis from June, also falling in line with the unadjusted series.
By comparison, the seasonally adjusted aluminum base scrap PPI registered a 13.5% month-to-month gain, reflecting the fact that July typically trends softer for scrap prices. Because prices instead rebounded, the adjusted parameters amplified the increase. The alignment of individual grades with the lower, non-adjusted index suggests the rebound was still sharp and historically unusual, but not as extreme as the adjusted headline figure implied.
In other words, spot scrap prices rose sharply in July, though the magnitude of the spike was tempered compared to what the seasonally adjusted data would indicate.
Conclusion
The July data makes clear that the apparent strength in metals shipments is an illusion once inflation is accounted for.
Primary and fabricated metal producers reported nominal gains in shipments and new orders, but after deflating for price indexes that surged by double digits in some cases, the reality was a contraction in real volumes.
Scrap, exempt from Section 232 tariffs, has become both a pressure valve and a source of volatility, spiking to record levels in July after the sharp spring pullback. Mill shapes posted the largest sustained increases in PPI, underscoring how inflation in raw and semi-finished products ripples forward.
Yet as costs move downstream, the increases splinter, with structural and fabricated categories registering smaller gains and internal combustion engines showing relatively muted price movement.
The net effect is margin compression.
Each stage of the supply chain absorbs part of the upstream surge but rarely passes it through in full, leaving no link fully insulated from pressure.
For producers, this means shrinking real output despite higher reported values. For downstream manufacturers, it means balancing cost inflation from castings and scrap against competitive limits on pricing finished goods.
In other words, the sector looks nominally stable but in practice is defined by contracting volumes, sharp price swings, and uneven cost pass-through.
The data puts numbers to a reality that many in the industry already recognize. So, in this case, the challenge has not been hidden, only increasingly quantified.