Aluminum Scrap Markets

September 22, 2026
AMU Survey: Aluminum sheet lead times reverse course
Written by Nicholas Bell
Aluminum sheet lead times reverse
Average aluminum sheet lead times increased to about 7.8 weeks from 6.4 weeks in August, reversing most of the prior month’s contraction. All three measured sheet products increased.
The increase also contrasted sharply with August, when common alloy and auto body sheet both shortened substantially.
Auto body sheet rose to 9 weeks from 7.81 weeks, returning to the survey high recorded in July. Can sheet increased to 7 weeks from 6 weeks, while common alloy sheet rose to 7.66 weeks from 6 weeks.
September did not represent a uniform return to July conditions though. Auto body sheet does return to its July high, while common alloy remains below July’s 8.5 weeks. Can sheet instead reached its highest reading since January.
The increase in aluminum sheet lead times also contrasts with several of September’s broader supply indicators, although measured extrusion and primary aluminum lead times were unchanged. Respondents became more likely to say new supply was keeping pace with demand, while inventory holdings moved further toward stability.
Broader aluminum lead times remain stable
Qualitative lead times were little changed from August’s unanimous stability. About 91% of September respondents reported stable lead times, while 9% reported extension and none reported shrinking lead times.
By end markets served, the results showed little broad pressure. All non-recycler transportation and machinery/industrial equipment respondents reported stable lead times. Extending responses were limited to the building and construction market.
The qualitative results did not fully mirror the measured lead time data. Sheet waits increased across all of the measured products, while measured extrusion and primary aluminum lead times were unchanged.
The broader qualitative question can reflect conditions elsewhere in respondents’ supply chains, while the measured series isolates specific mill products.
New supply keeps pace with demand
The largest supply-side change came from the question on new US primary and semi-fabricated supply.
About 88% said new supply was keeping pace with demand, up from 42% in August and 31% in July. That was the highest “yes” share in the question’s survey history.
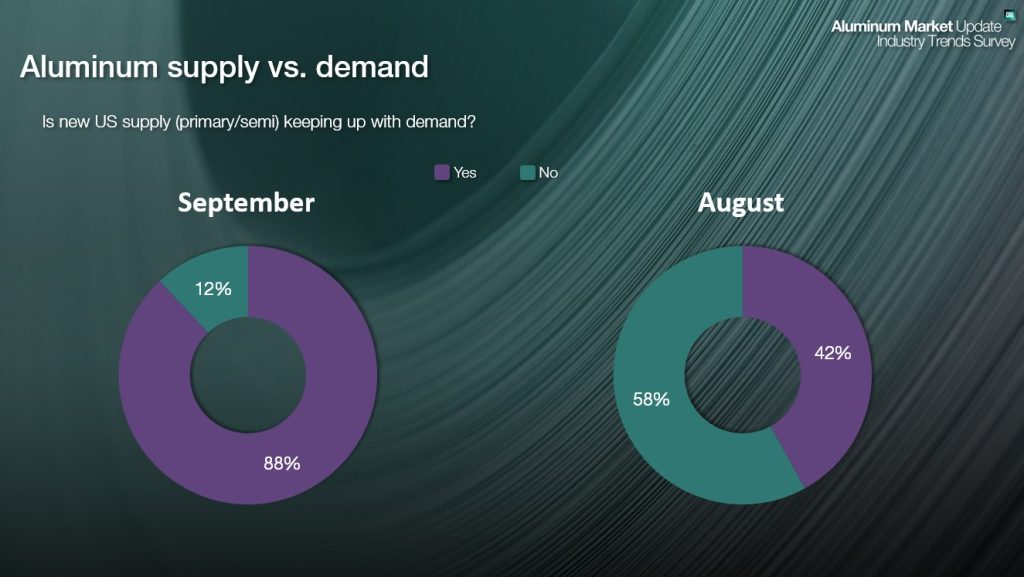
Market participants serving the building and construction and transportation end markets all said supply was keeping pace after being fairly evenly split in the prior month.
Demand does not provide a clear explanation for the divergence. Non-recycler demand remained about as positive in August overall, while building and contraction and transportation responses became less positive.
As a result, the survey responses provide little evidence of a broad demand acceleration accompanying September’s longer sheet waits.
Import competitiveness holds after August shift
Tangentially, September did not extend August’s move toward greater import competitiveness. All respondents reported no change in the most recent survey.
In August, about 63% of non-recycler respondents reported greater import competitiveness. Nevertheless, because the question asks whether imports are becoming more competitive, September’s result does not infer that imported material became less competitive.
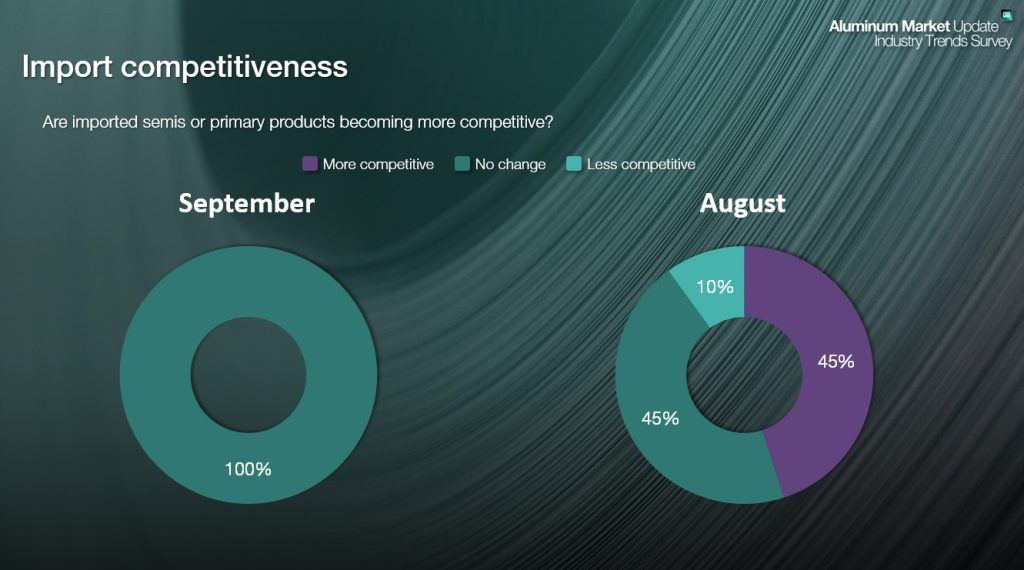
The September result on import competitiveness therefore provides less of a directional explanation for the sharp increase in respondents saying new US supply was keeping pace with demand. Still, if August’s shift persisted into September, imported material could have remained competitive without generating another month-to-month change in the survey response.
The timing leaves open the possibility that buyers acted on more attractive import offers in August, with some of that material contributing to September supply, especially if they were buying for the fourth quarter.
Inventory moves toward stability
Inventory management moved heavily toward stability, particularly among non-recyclers.
Excluding scrap recyclers and processors, about 86% kept inventories steady, while the remaining share reported drawing down inventory. That compares with August, when roughly 75% of non-recyclers kept inventories stable, 17% drew down, and 8% built stocks.
Recycler inventories changed sharply. About 75% reporting keeping inventories steady in September, while 25% continued drawing down. In August, two-thirds of recyclers had reported drawdowns.
The shift could represent the next stage of the inventory drawdown reported in August, with more respondents reaching levels they were comfortable maintaining by September.
The month-to-month pattern resembles the possible timing effect in non-recycler import competitiveness. August may have represented the period of adjustment, followed by a more stable condition in September. For recyclers, that could mean inventories had already moved toward levels respondents were more comfortable maintaining rather than beginning another directional change.
Forward outlook splits by company role
The overall three-month outlook result moved sharply away from August’s concentration around balance.
Balanced and oversupplied responses each accounted for about 36% in September. Another 27% expected undersupply.
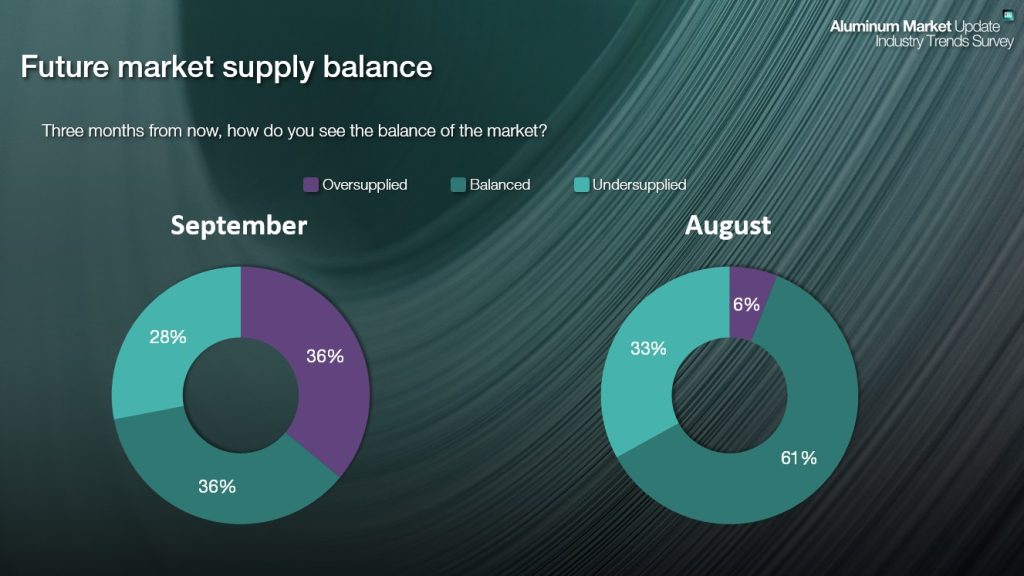
The oversupplied share rose from just 6% in August and tied the highest reading in the survey series. Scrap recyclers and processors drove most of that increase.
Among non-recyclers, about 57% still expected balance, compared with 67% in August. Another 29% expected undersupply and 14% expected oversupply.
The non-recycler distribution remained centered on balance despite the increase in measured sheet lead times. It also aligns more closely with the sharp increase in respondents saying new primary and semi-fabricated supply was keeping pace with demand.
Supply signals diverge from sheet lead availability
September produced a split between respondents’ broader supply assessments and measured sheet availability. Aluminum sheet lead times increased across all three measured products, while a record share of respondents said new US supply was keeping pace with demand.
Other indicators leaned toward stability rather than tightening. Non-recycler inventories moved further toward steady holdings, while most expected a balanced market over the next three months. Qualitative lead times also remained overwhelmingly stable.
September therefore does not describe a broad tightening across aluminum products. Instead, the survey isolates longer waits in sheet within a market where respondents became more comfortable with overall supply availability.