
Distribution
May 7, 2025
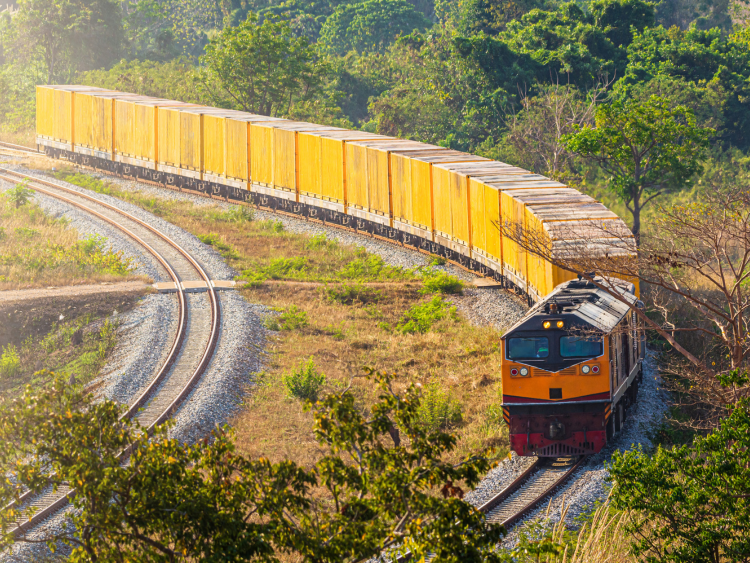
Association of American Railroads freight volumes
Written by Greg Wittbecker
The Association of American Railroads (AAR) publishes monthly freight indices and carload volumes which are a good barometer of economic activity. Canadian carriers CN and CP participate in this reporting, so aluminum imports from Canada are embedded in these numbers.
The AAR numbers will become increasingly useful in tracking inbound container freight from Asia, as they report intermodal movements monthly.
For the latest reporting month of February, AAR reported that intermodal shipments were up 6.4% year on year at 66,340 units. The container volume was up 9.3%. This seems consistent with evidence that there was a great deal of front-end loading of imports ahead of the expected tariff increases.
Carload shipments by leading commodities:
| COMMODITY | FEB 2025 | FEB 2024 | % CHANGE |
| Chemicals | 56,895 | 51,491 | 10.5 |
| Trailers/Containers | 42,005 | 34,006 | 23.5 |
| Grain | 26,994 | 28,989 | -6.9 |
| Coal | 20,504 | 25,026 | -22.3 |
| Metals and Prods. | 19,561 | 19,323 | 1.7 |
| Crushed Stone | 18,470 | 22,451 | -17.7 |
| Pulp and Paper | 14,286 | 13,855 | 3.1 |
| Food Products | 13,908 | 12,133 | 11.7 |
| Stone, Clay, Glass | 12,264 | 12,142 | 1.0 |
| Waste and Scrap | 10,611 | 10,868 | -2.4 |
| Motor Vehicles | 9,921 | 10,198 | -2.7 |
| Lumber | 8,376 | 9,354 | -10.5 |
It will be important to watch these categories in coming months as the impact of tariffs begins to sink in.
Categories deserving special scrutiny:
- Trailers and Containers- will tell us how much Trans-Pacific sailings are being reduced as China tariffs bite.
- Metals- steel and aluminum shipments as Section 232 start to weigh on imports.
- Scrap- really a measure of steel scrap movements not aluminum.
- Motor Vehicles- are domestic OEM assembling and selling more vehicles as import tariffs take their toll.
- Lumber- how are single family housing starts doing and what impact are the IEEPA duties having on Canadian softwood imports.